The AI score went up. What actually improved?
Four October studies show why a better AI score isn't always a reason to launch. Here's what I'd check about the measurement first.
A higher AI score can quickly become a reason to remove a review step or give an agent more responsibility. I’d want to check a few things first.
Did the agent finish the job? Did the grader change? Were the difficult cases left out?
Four papers published this October give those questions some weight. My takeaway: keep the task, system, grader and date attached to the score. Without them, it’s hard to tell what actually improved.
About the evidence: these are findings from four preprints, not experiments independently reproduced by Model Fieldnotes. The charts redraw published figures; the zero-failure example is an illustrative calculation. The studies use different measures, so I haven’t combined them into an industry-wide score.
A model leaderboard can choose the wrong agent
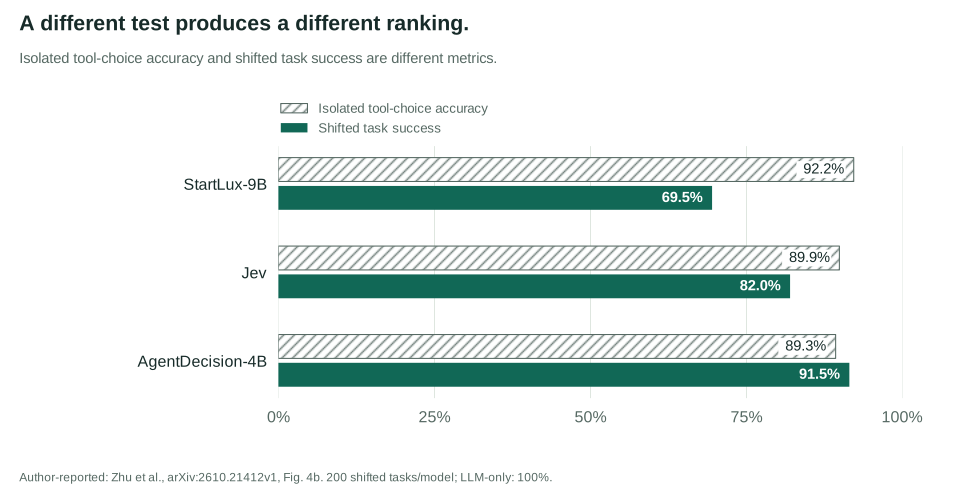
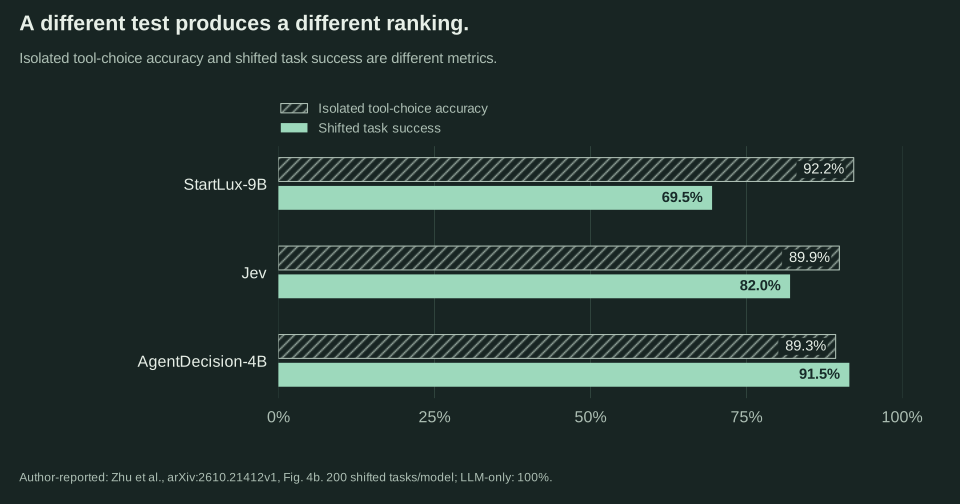
The 15 October JevAgentHarness paper compares decision models on isolated questions and inside a running agent.
StartLux-9B scored 92.2% on isolated tool selection, ahead of AgentDecision-4B’s 89.3%. Inside the shifted-task evaluation, their order reversed: 69.5% versus 91.5% task success. Jev reached 82.0%. Each ran on 200 shifted DecisionGym tasks with Gemini 3.5 Flash handling the rest of the agent; that LLM alone solved 100%.
The ranking changes when the agent has to act.
On small screens, swipe the chart or focus it and use the arrow keys. A text table is below.
Read the data and denominators
Isolated accuracy and agent task success. On narrow screens, swipe or focus the comparison and use the arrow keys to scroll.
| Decision model | Isolated tool accuracy | Shifted task success |
|---|---|---|
| StartLux-9B | 92.2% | 69.5% / 200 tasks |
| Jev | 89.9% | 82.0% / 200 tasks |
| AgentDecision-4B | 89.3% | 91.5% / 200 tasks |
Isolated BFCL tool-choice accuracy and shifted DecisionGym task success are different metrics on different task sets. L3 replaces tool choices; it is not the confidence-gated deployment experiment.
These are different task sets and metrics, so the gap isn’t an “accuracy loss.” What matters is that the ranking reversed once decisions affected later steps. That’s a finding about this environment, not every deployment of these models.
For a support-routing agent, I’d check resolutions, escalations and account state, including what happens after a wrong turn. That’s the question behind my Jev and Strands Decider analysis: where can a cheaper decision safely take control? A recorded classification test can’t answer it alone.
The harness can matter more than the model upgrade
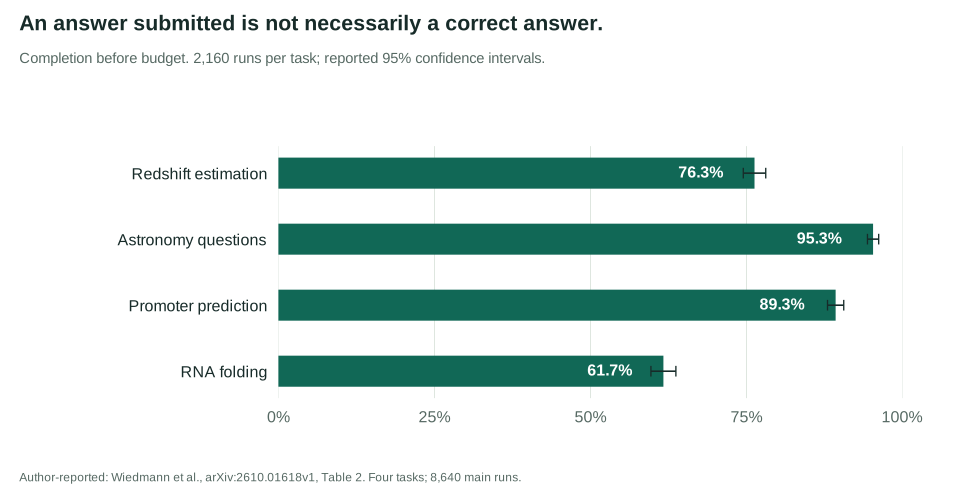
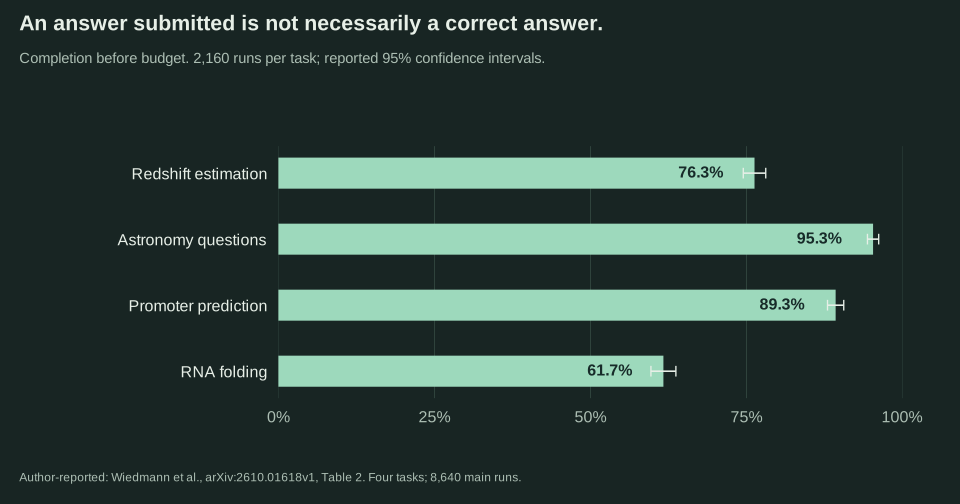
In Wiedmann and colleagues’ 1 October study, agents operate specialist models on four scientific tasks: 432 configurations per task, five repeats each, and 8,640 runs.
Among completed runs that cleared a minimum-quality hurdle, about 54% of score variance came from repeats of the same configuration. This pooled analysis covers three of the four tasks. Information supplied to the agent had the largest configuration effect in this study, ahead of model choice and time budget.
Submitting an answer is a separate outcome.
On small screens, swipe the chart or focus it and use the arrow keys. A text table is below.
Read the data and denominators
Scientific-task completion rates. On narrow screens, swipe or focus the comparison and use the arrow keys to scroll.
| Task | Runs | Submitted before budget |
|---|---|---|
| Redshift estimation | 2,160 | 76.3% ± 1.8 points |
| Astronomy questions | 2,160 | 95.3% ± 0.9 points |
| Promoter prediction | 2,160 | 89.3% ± 1.3 points |
| RNA folding | 2,160 | 61.7% ± 2.0 points |
Completion is submitting before the time budget, not answer quality. Error margins are the paper's reported 95% confidence intervals. The variance decomposition pools completed, hurdle-clearing runs of the three gap-positive tasks, not all AI work.
Completion here means submitting before the budget expires, regardless of correctness. The study covers one harness and three sizes of Qwen3.5 on scientific tasks; it doesn’t show that context always beats model capability.
I’d keep the surrounding software fixed when comparing models: tool documentation, retrieved context, permissions, memory and retry limits. Otherwise, several things change at once.
I’d also keep unfinished work visible. Imagine an invoice-routing workflow. Count the invoices routed correctly, those routed incorrectly, and those still waiting. Reporting quality only for completed work can hide the hardest cases in the timeout pile.
Sometimes the ruler changed
The 4 October production study by Zhang and Esposito follows a voice-and-video interviewing agent. It analyzes 2,611 production recordings in 14 batches, with three overlapping reviewers, from March to August 2026.
Reviewers A and B differed by about 0.79 standard deviations on the composite measure after accounting for batch. The reviewer-adjusted, smoothed improvement over time was 0.53 standard deviations. These are different estimates, but the size of the reviewer gap is hard to ignore.
This is one observational deployment. The authors can’t fully account for interview mix, establish a causal benefit from evaluation or validate hiring decisions.
My concern is simple: a changed reviewer pool can make “quality improved” harder to interpret. So can a new AI judge, prompt or rubric. When changing the grader, I’d keep shared cases and inspect disagreements before joining the old and new trend lines.
A longer time horizon needs a careful translation
METR’s 50% time horizon describes human task duration at which an agent is predicted to succeed half the time. It doesn’t mean the agent ran autonomously for that long, or can automate half a job. The tasks are mostly software, ML and cybersecurity.
The 8 October reanalysis by Nguyen and Fithian revisits 228 tasks and 26 AIs. Moving from 3 to 30 minutes and from 30 minutes to 5 hours are both tenfold increases in human time, but need not represent comparable increases in AI difficulty. They recommend diagnostic plots alongside the headline horizon.
For a product decision, I’d still want to know how many of our cases finish correctly, with what supervision, and how quickly we detect failures. A human-time headline can’t tell me that.
The linked METR page was last updated on 8 September 2026 and is no longer actively maintained. It’s useful for definitions, not today’s complete model ranking.
Even a perfect test has a denominator
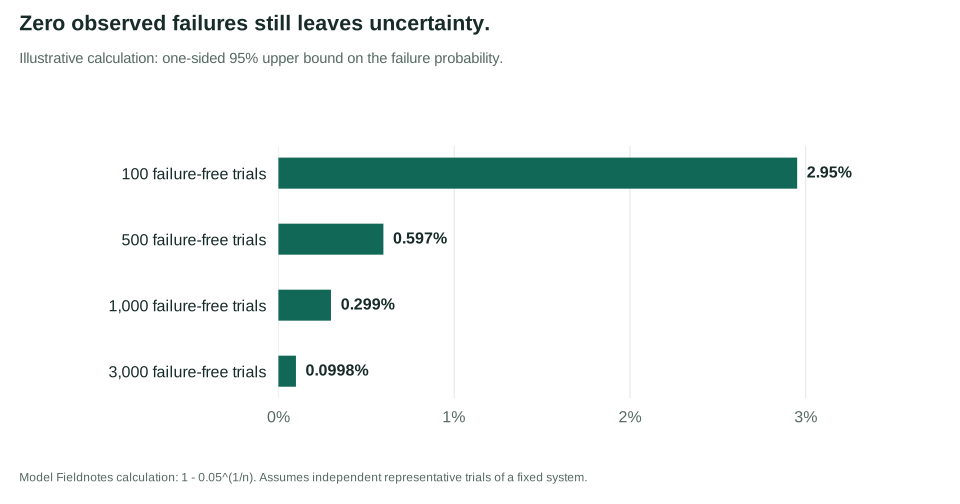
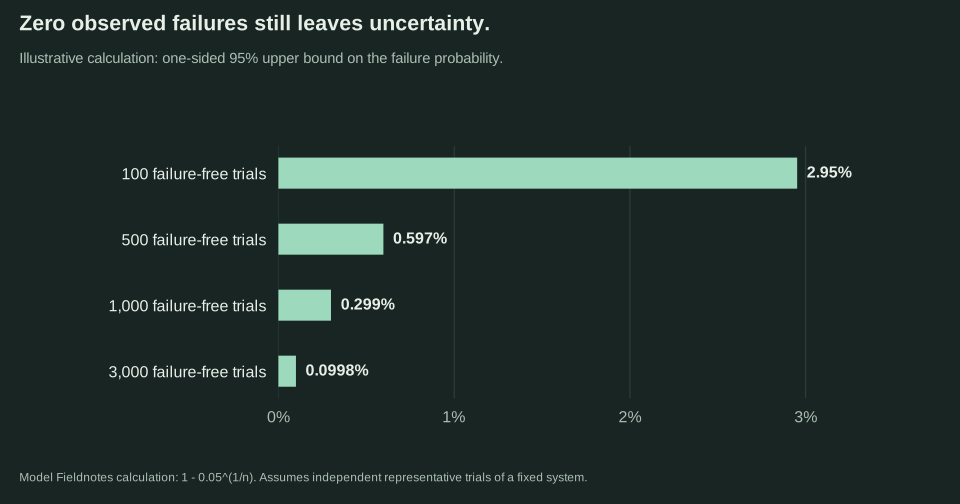
Here’s an illustration, not another agent test. An unchanged system passes 100 independent, representative trials with zero failures. The exact one-sided 95% upper confidence bound on its failure probability is still about 2.95%. That perfect test set hasn’t established 99.9% reliability.
A perfect test still leaves uncertainty.
On small screens, swipe the chart or focus it and use the arrow keys. A text table is below.
Read the data and denominators
Illustrative zero-failure confidence bounds. On narrow screens, swipe or focus the comparison and use the arrow keys to scroll.
| Independent trials | Observed failures | 95% upper failure bound |
|---|---|---|
| 100 | 0 | 2.95% |
| 500 | 0 | 0.597% |
| 1,000 | 0 | 0.299% |
| 3,000 | 0 | 0.0998% |
The observed failure rate is zero in every row. The bound describes remaining statistical uncertainty, not an estimate that this many failures occurred.
The calculation is 1 − 0.05^(1/n), from the binomial probability of zero failures, (1 − p)^n = 0.05. It’s the one-sided zero-failure case of the exact-tail method in the NIST handbook: a confidence bound, not a posterior probability or an observed failure rate.
Under those assumptions, at least 2,995 failure-free trials put the upper bound below 0.1%. This isn’t a blanket sample-size recommendation. Repeating closely related prompts may not give independent evidence, and a thousand versions of an easy workflow may miss the failure that matters. A changed prompt, retrieval index or permission boundary can also make yesterday’s results less useful.
The evidence I would ask for before launch
I’d want this short record beside any launch recommendation.
A proposed AI launch evidence record. On narrow screens, swipe or focus the comparison and use the arrow keys to scroll.
| Record | Question it should answer | Example of a missing condition |
|---|---|---|
| System | What exact configuration did we test? | A model version is recorded, but the tool schema and retrieval snapshot are not. |
| Work | Which cases did we test, and how many times? | Timed-out cases are omitted from the reported quality score. |
| Measurement | Who graded it, and can we compare the grades? | The judge changed between releases without shared cases. |
| Outcome | Did the action actually happen? | The agent reports a refund, but the ledger was never checked. |
| Recheck | What change would make these results need another look? | A tool update changes the action contract after the evaluation. |
Anthropic’s evaluation guidance makes a useful distinction here: the transcript and the resulting environment state. An agent saying a booking exists isn’t the same as a reservation existing in the database. Individual tasks and repeated trials also need separate counts.
Compare the current system and its replacement on the same recorded cases. Add failures from the live workflow, and report unfinished work, unsafe actions, human intervention and cleanup alongside correct completion.
The threshold should fit the action. A reviewed draft and an irreversible financial change need different evidence, even if they use the same model. Someone also needs to own the decision to expand, or pause, when conditions change.
What I would change on Monday
Pick one workflow your team is about to expand. Write down the system revision, cases, grader and outcome check. Leave the missing fields visible. Fix an unclear denominator before ordering another benchmark run.
Then ask: what additional responsibility does this evidence support? That’s the decision I’d want the review to settle.
Download the launch-evidence worksheet, the transcribed research figures and the illustrative calculations. The CSVs contain aggregate figures and arithmetic, not original participant records or a new benchmark dataset.
For a worked example, try the lost-response retry experiment. For the financial side, see cost per completed task.
Follow the evidence
Sources & further reading
- Zhu et al.: JevAgentHarness: Benchmarking, Deploying and Training Decision Models That Share Control with LLMs; v1, 15 October 2026 ↗
- Wiedmann et al.: Agents Are Systems, Not Models: Rethinking Agentic Evaluation; v1, 1 October 2026 ↗
- Zhang and Esposito: Reliability of AI Agents: Rater Effects, Drift, and the Return to an Evaluation Program; v1, 4 October 2026 ↗
- Nguyen and Fithian: On the estimation and validity of AI time horizons; v1, 8 October 2026 ↗
- METR: Task-Completion Time Horizons: definitions, limitations and update status ↗
- NIST/SEMATECH e-Handbook: Exact binomial confidence intervals ↗
- Anthropic Engineering: Demystifying evals for AI agents; 9 January 2026 ↗
Sources checked Oct 23, 2026. Research and drafting assisted by AI.
Suggest a correction